Writing · Task 1
You should spend about 20 minutes on this task.
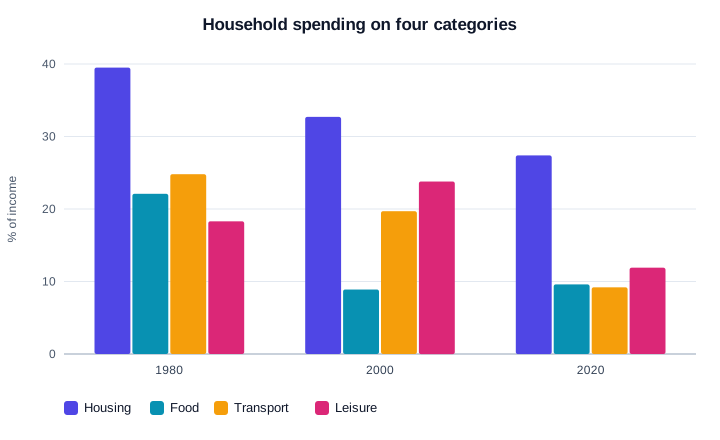
The bar chart below shows household spending on four categories (% of income).
Summarise the information by selecting and reporting the main features, and make comparisons where relevant.
Write at least 150 words.
Data table
| 1980 | 2000 | 2020 | |
|---|---|---|---|
| Housing | 39.5 | 32.7 | 27.4 |
| Food | 22.1 | 8.9 | 9.6 |
| Transport | 24.8 | 19.7 | 9.2 |
| Leisure | 18.3 | 23.8 | 11.9 |
Write at least 150 words. Recommended time: 20 minutes.
Version · words
OverallAI feedback is an estimate and may differ from an official IELTS examiner.
No submitted versions yet.
-
Version · words
Sign in to save drafts and get AI feedback.
Looking up…
Form of
বাংলা অর্থ
বাংলা অর্থ খোঁজা হচ্ছে…
বাংলা অর্থ পাওয়া যায়নি।
Looking up the English meaning…
No English definition found.
No definition found for this word.